Economic data shapes the decisions of investors around the world. Shifts in inflation, employment, and trade figures can influence where money flows and how portfolios are built. Understanding these trends is not only important for professionals but also for everyday investors who want to make informed choices. The way global economic data is reported and interpreted has changed over the years, making it more accessible and relevant to a wider audience.
Recent years have seen increased volatility in markets, often tied to changes in economic indicators. Investors now have access to real-time data and analysis, which can help them respond quickly to new information. However, the sheer volume of data can be This article breaks down the most significant trends in global economic data and explains what they mean for investors today.
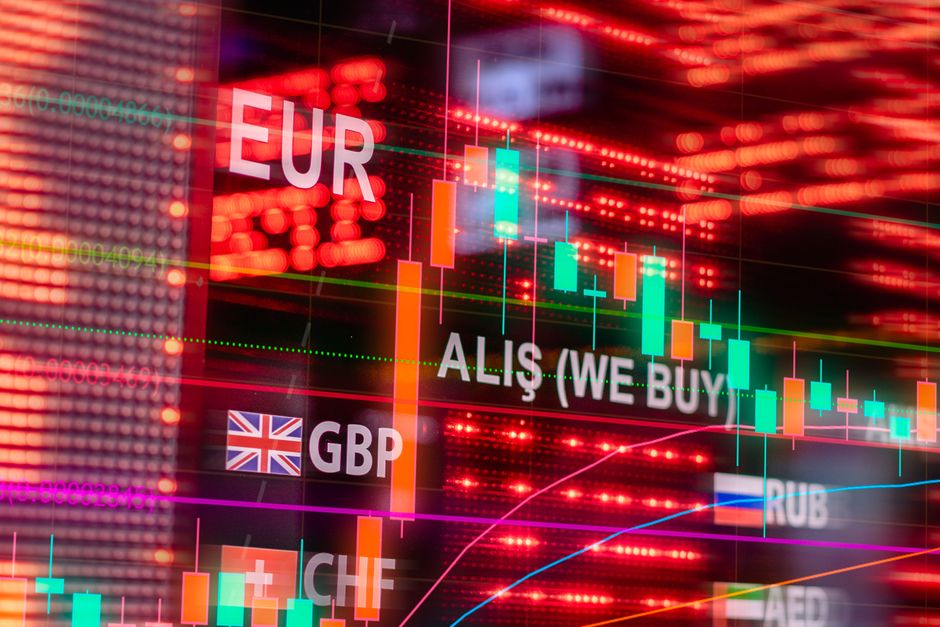
By looking at both recent developments and historical patterns, it becomes clear that certain economic signals carry more weight than others. Factors such as inflation rates, central bank policies, and global trade flows are closely watched. Each of these areas provides clues about where markets may be headed and how investors can position themselves to benefit or protect their assets.
Key Economic Indicators Investors Track
Investors rely on a range of economic indicators to guide their decisions. These indicators serve as benchmarks for understanding the health of economies and the potential direction of markets. Some of the most commonly followed indicators include:
- Gross Domestic Product (GDP): Measures the total value of goods and services produced within a country.
- Inflation Rate: Tracks changes in the cost of goods and services over time.
- Unemployment Rate: Shows the percentage of people without jobs who are actively seeking work.
- Interest Rates: Set by central banks, these rates influence borrowing costs and investment returns.
- Trade Balances: Reflects the difference between a country's exports and imports.
The table below summarizes recent data for some of these indicators from major economies:
| Country | GDP Growth (2023) | Inflation Rate (May 2024) | Unemployment Rate (May 2024) |
|---|---|---|---|
| United States | 2.5% | 3.3% | 3.9% |
| Eurozone | 0.8% | 2.6% | 6.4% |
| China | 5.2% | 0.4% | 5.1% |
| Japan | 1.1% | 2.8% | 2.7% |
This data is sourced from organizations such as the International Monetary Fund (IMF), OECD, and national statistics agencies.
The Role of Inflation in Investment Decisions
Inflation remains a central concern for investors because it affects purchasing power and investment returns. When inflation rises, the value of money decreases, which can erode real returns on savings and fixed-income investments. Central banks respond to inflation by adjusting interest rates, which in turn impacts borrowing costs and asset prices.
The past few years have seen inflation rates fluctuate due to factors such as supply chain disruptions, energy price shocks, and changes in consumer demand. In 2022 and 2023, many countries experienced higher-than-average inflation, prompting central banks like the U.S. Federal Reserve and the European Central Bank to raise interest rates. These moves aimed to slow down price increases but also led to higher borrowing costs for businesses and consumers.
For investors, periods of high inflation often lead to shifts in asset allocation. Stocks in sectors like energy and consumer staples may perform better during inflationary periods, while bonds can lose value as interest rates rise. Real assets such as real estate or commodities are sometimes used as hedges against inflation.
Monitoring inflation data helps investors anticipate changes in monetary policy and adjust their strategies accordingly. Reliable sources for inflation data include government statistics offices and central bank reports.
Interest Rates and Central Bank Policies
Interest rates set by central banks play a major role in shaping investment returns. When rates are low, borrowing is cheaper, which can boost economic growth and support higher stock prices. Conversely, higher rates tend to slow down borrowing and spending, which can put pressure on equity markets.
The cycle of raising or lowering interest rates is often driven by economic conditions such as growth rates and inflation levels. In recent years, central banks have had to balance the need to control inflation with the goal of supporting economic recovery after global disruptions like the COVID-19 pandemic.
Investors pay close attention to statements from central banks, as these can signal upcoming changes in policy. Even small adjustments in interest rates can have significant effects on bond yields, currency values, and stock market performance.
- Bonds typically lose value when interest rates rise because new bonds offer higher yields.
- Currencies may strengthen or weaken depending on rate changes relative to other countries.
- Stock markets often react quickly to unexpected rate decisions or guidance from central banks.
The impact of interest rate changes varies by region and asset class, so investors need to consider both global trends and local conditions when making decisions.
Global Trade Patterns and Their Impact
Trade flows between countries influence economic growth and investment opportunities. Changes in trade policy, tariffs, or supply chain dynamics can affect corporate profits and market sentiment. Recent years have seen disruptions due to geopolitical tensions, new trade agreements, and shifts in manufacturing locations.
The COVID-19 pandemic exposed vulnerabilities in global supply chains, leading many companies to rethink their sourcing strategies. Some countries have moved toward reshoring or diversifying suppliers to reduce risk. These changes can create both challenges and opportunities for investors who track companies involved in international trade.
Trade balances are another important indicator. A country with a large trade surplus may see its currency appreciate, while persistent deficits can lead to downward pressure on exchange rates. Investors who follow trade data can identify trends that may affect sectors such as manufacturing, technology, or agriculture.
Reliable trade data is available from organizations like the World Trade Organization (WTO), national customs agencies, and financial news outlets that analyze trade statistics.
The Shift Toward Sustainable Investing
Sustainable investing has become more prominent as investors seek to align their portfolios with environmental, social, and governance (ESG) criteria. Economic data now includes metrics related to carbon emissions, renewable energy investment, labor practices, and corporate governance standards.
This shift reflects growing awareness of climate risks and social responsibility among both institutional and retail investors. Companies that score well on ESG metrics may attract more capital, while those with poor records can face higher costs or reduced access to funding.
- Sustainable funds have seen significant inflows over the past five years.
- Regulatory requirements for ESG disclosure are increasing in many regions.
- Data providers now offer detailed ESG ratings for thousands of companies worldwide.
Sustainable investing is not limited to specific sectors; it affects asset selection across industries. Investors who incorporate ESG data into their analysis may benefit from reduced risk exposure and access to new growth opportunities.
Navigating Data Overload: Tools for Investors
The amount of economic data available today can be Investors use various tools to filter information and identify relevant trends. Financial news platforms, economic calendars, and analytics software help users track key indicators in real time.
Many investors also rely on professional research from banks, asset managers, or independent analysts who interpret complex data sets. These experts provide context for raw numbers and highlight potential implications for different asset classes.
The table below lists some popular sources of economic data used by investors:
| Source | Type of Data Provided | Access |
|---|---|---|
| Bloomberg | Market news, economic indicators, company data | Subscription/Free summaries |
| Trading Economics | Global macroeconomic statistics | Free/Paid features |
| FRED (Federal Reserve Economic Data) | U.S. economic time series data | Free |
| Statista | Global statistics across sectors | Subscription/Free samples |
| World Bank Data | International development indicators | Free |
Selecting trustworthy sources is essential for accurate analysis. Investors should cross-check information when possible and stay updated on methodological changes that could affect reported figures.
How Investors Can Respond to Economic Trends
Navigating global economic trends requires a disciplined approach. Investors need to balance short-term market movements with long-term goals. Diversification remains one of the most effective strategies for managing risk in uncertain environments.
- Diversify across regions: Exposure to multiple countries can reduce risk from local downturns.
- Monitor sector performance: Some sectors respond differently to changes in economic indicators.
- Stay informed: Regularly review updates from reliable sources to adapt strategies as needed.
- Consider professional advice: Financial advisors can help interpret complex data and tailor recommendations to individual needs.
The ability to interpret economic data is a valuable skill for any investor. By focusing on key indicators and using credible resources, individuals can make more confident decisions even during periods of uncertainty.
Investors who adapt by staying informed about major trends (such as inflation dynamics, central bank actions, trade patterns, and sustainable investing) are better positioned to manage risk and identify new opportunities. Access to high-quality data combined with thoughtful analysis supports smarter investment choices in a complex world.
References: